
 ×
×
How to right-size a co-location battery.
A repeatable method for finding the storage size that maximises project return and turning it into a design you can actually procure. Shown step by step on a greentech PV project in Germany, sized with Catalyst by phelas.
greentech is an integrated solar and storage specialist and covers the full value chain — from project development through planning and construction to operations and asset management of PV power plants and battery energy storage systems (BESS). Adding BESS to PV can create a double benefit: it stabilises feed-in and often increases economic attractiveness compared with PV-only projects. To determine the optimal storage sizing, greentech uses the Catalyst application by phelas.
What the optimal battery adds
The right-sized storage lifts a thin PV-only return into clearly attractive territory.
Project IRR (EQ)
+0.66 pp vs. PV-only
At the optimum
40% of the grid connection
Storage value
share of project revenue
01 · Five things to know
The right-sized battery lifts the return.
The PV plant shares a common grid connection with a battery. On its own it earns a thin IRR of 8.69% — a marginal return on a standalone basis.
Adding an optimally-sized battery lifts that to 9.35% IRR. The storage is what turns a marginal project into an attractive one — the whole question is the size that does it.
Catalyst evaluated 20 storage variants across 2 PV generation profiles. IRR peaks at 40% of the grid connection over 3 hours in both. The realisable design — framed by the nearest standardised transformer — sits at ~45% / 2.8 h, on the value plateau.
01Storage turns a marginal return into an attractive one.
PV-only delivers a thin 8.69% IRR. The right-sized battery lifts it to 9.35% — the difference between a marginal and an attractive project.
02IRR peaks at 40% power / 3 hours.
Across both PV generation profiles the IRR-maximising configuration is 40% of the connection over 3 hours — the design target.
03Bigger destroys value.
Pushing storage power to 80–100% adds CapEx the extra arbitrage can't earn back — IRR drops below the PV-only baseline. The economic optimum is reached well before maximum size.
04The realisable design ≈ the optimum.
No transformer or inverter maps exactly to the theoretical optimum, so the planned design is sized around the nearest standardised transformer station — ~45% / 2.8 h. Because the IRR curve is flat near its peak, it captures essentially the full value of the target. (Currently in planning.)
05The case holds across PV yield.
Tested on both a median (P50) and a conservative (P90) generation year, storage lifts IRR and the optimum stays at 40% / 3 h. The sizing decision is robust to how sunny the year turns out.
Headline result
Base case (P50) · 40% / 3 h optimum vs. PV-only
Project IRR
PV-only
8.69%
with storage
9.35%
+0.66 pp vs. PV-only
Optimum → planned
40% target · ~45% planned, on a standardised transformer station · in planning
- Storage CapEx at optimum
- €3.62M
- Total project CapEx
- €15.53M
- PV generation profiles
- 2 (P50 · P90)
- Variants per profile
- 20 + PV-only
02 · Sizing as a method
As merchant exposure grows and subsidy support narrows, PV-only projects are often no longer attractive enough on their own — they sit right at, or just below, an investor's hurdle. A co-located battery converts curtailed energy and price volatility into a second income. But the value is entirely dependent on getting the size right: oversize it and the extra CapEx never earns out; undersize it and the upside is left unclaimed.
So the right size is not a rule of thumb — it is an optimisation. The five steps below are the repeatable method greentech and phelas applied to this project, and the rest of this page walks through each one with the project's real numbers.
Frame the project
Grid connection, PV profile, the sizing question.
Define scenarios
Two PV generation profiles, median and conservative.
Sweep with Catalyst
Every size, every profile — ranked by IRR.
Read the optimum
Where the return peaks: 40% power / 3 hours.
Make it realisable
Translate the target into a procurable design.
Step 1 · The Project
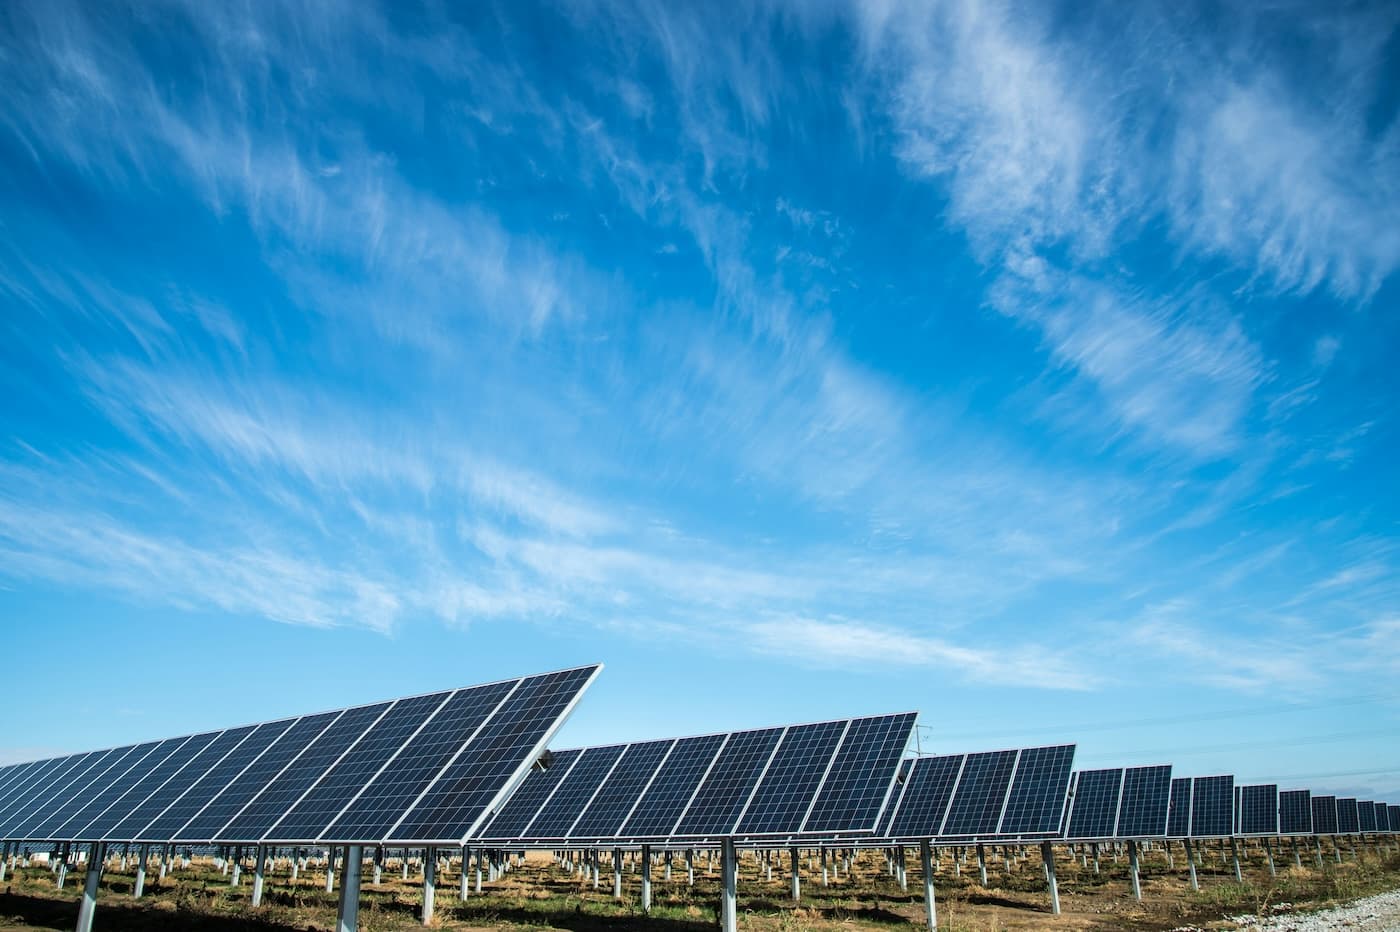
A PV plant in Germany sharing a single grid connection point with a co-located lithium battery. The two assets are jointly optimised: PV can feed in directly under its EEG arrangement, or charge the battery, which then dispatches into the Day-Ahead and Intraday markets. As a green-power storage system, the battery charges only from the PV plant — never from the grid. The project is a realistic, representative use case for storage sizing in a PV co-location.
Reference (PV-only) vs. co-location (PV + battery)
In the reference scenario PV flows directly to its EEG feed-in through the grid connection, and surplus beyond the limit is curtailed. In the co-location scenario PV can instead charge the battery, which dispatches into the Day-Ahead and Intraday markets — jointly optimised with the direct PV output.
Generation asset
PV Plant · Germany
Germany · PV capacity ~130% of the grid connection (~1.3× overbuild, feed-in limit) · EEG-supported feed-in · meaningful curtailment without storage · CapEx 460 €/kW (€11.91M)
Storage asset
Co-located lithium battery (BESS)
Swept across 5 power levels (20–100%) × 4 durations (1–4 h) · Day-Ahead + Intraday dispatch · green-power (no grid import) · 20-yr life
Step 2 · The Scenarios
Test the yield.
A single forecast would give a single, fragile answer. The project is therefore evaluated under two PV generation profiles — a median (P50) and a conservative (P90) year — on the central price path. Each of the 21 configurations is run under both, so the sizing decision can be checked for robustness: the optimum should hold whether the year is sunny or not.
How the 42 business cases come together
Storage configurations · power × duration
| 20% | 40% | 60% | 80% | 100% | |
|---|---|---|---|---|---|
| 1h | |||||
| 2h | |||||
| 3h | |||||
| 4h |
only
no storage
■ 40% / 3 h = economic optimum
21 configurations (5 × 4 + no storage)
PV generation profiles
P50
median yield (base)
P90
conservative yield
2 profiles
42
business cases
central price path
Steps 3 & 4 · Optimise with Catalyst · Where the return peaks
Rather than test one assumed size, Catalyst co-optimises the PV plant and battery at quarter-hourly resolution and evaluates every storage configuration in parallel — comparing all power-and-capacity (duration) combinations side by side. The sweep covers 5 power levels × 4 durations plus a PV-only baseline, under both PV profiles. Each case produces a full project cashflow, from which the IRR follows. The result is not one recommendation but a return surface, which makes the optimum — and the cost of departing from it — visible.
How the IRR is formed · greentech working assumptions
Inflation
2%
Horizon
30 yr
PV 30 yr · BESS 20 yr
PV CapEx
460 €/kW
PV OpEx
3.3%
Storage CapEx
138–292
€/kWh by duration + 5 €/kW
Storage OpEx
3.5%
Storage life
20 yr
retired, no replacement
Charging
PV-only
green, no grid
Markets
EEG · DA · ID
no ancillary
Financing
Unlevered
all-equity IRR
The IRR is computed on the full 30-year project cashflow: market revenue net of operating cost, less CapEx, with 2% inflation. The PV plant runs the full 30 years; the battery has a 20-year life and is not replaced — it retires after year 20, with no re-CapEx. Storage CapEx ranges from 138.25 €/kWh (4 h systems) to 292 €/kWh (1 h systems), plus a 5 €/kW power-conversion cost component. No ancillary-service revenue is modelled, so the case is a conservative floor. All IRRs are unlevered (100% equity, no debt financing) — a further conservative assumption, since leverage would increase the achievable equity returns.
Project IRR vs. storage power · one curve per duration
P50 · median yield (base case)
The planned design (◇) has a 2.8 h duration, sitting between the 2 h and 3 h curves at ~9.3% IRR in the base case — effectively on the value plateau.
Optimum · P50
40% · 3 h
IRR-maximising
- IRR (optimum)
- 9.35%
- IRR (PV-only)
- 8.69%
- IRR uplift
- +0.66 pp
- Storage CapEx
- €3.62M
Optimal storage lifts IRR by +0.66 pp vs. the PV-only project.
IRR by configuration (%) · P50
Every variant, side by side — optimum outlined
| Duration \ Power | 20% | 40% | 60% | 80% | 100% |
|---|---|---|---|---|---|
| 1 h | 8.47 | 8.51 | 8.57 | 8.46 | 8.25 |
| 2 h | 8.78 | 9.16 | 9.20 | 9.11 | 8.78 |
| 3 h | 8.94 | 9.35 | 9.30 | 9.01 | 8.48 |
| 4 h | 8.98 | 9.28 | 9.02 | 8.52 | 7.82 |
Cells at or above the PV-only baseline shade green; cells below it turn red — the deeper the red, the lower the IRR. Under both PV profiles the optimum sits at 40% power / 3 h.
Cross-profile summary
PV-only vs. optimum storage — IRR by generation profile
| PV profile | Optimum | PV-only IRR | Optimum IRR | IRR uplift |
|---|---|---|---|---|
| P50 · median yield (base case) | 40% / 3 h | 8.69% | 9.35% | +0.66 pp |
| P90 · conservative yield | 40% / 3 h | 7.68% | 8.50% | +0.82 pp |
Click a row to load that profile into the chart above.
Average annual revenue by source · PV-only vs. optimum (40% / 3 h)
One stream becomes three
Adding storage diverts some PV from direct EEG feed-in into the battery, which sells into Day-Ahead and Intraday. Net revenue rises and now comes from three partly independent sources. Storage cuts curtailment by ~44% (nearly halved). Average over project years.
Storage share of revenue
34%
- EEG feed-in
- ~66%
- Intraday
- ~32%
- Day-Ahead
- ~2%
- Curtailment
- −44%
Intraday is the battery's primary earner. No ancillary-service revenue is modelled, so this is a conservative floor.
The value plateau · base case (P50)
IRR is flat near the optimum — the planned design loses almost nothing
Plateau
40% · 3 h
IRR optimum at 3 h
- IRR (optimum)
- 9.35%
- IRR (planned, ~45% / 2.8 h)
- 9.30%
- Value retained vs. optimum
- 99.5%
Because the IRR curve is flat near its peak, the practically realisable design costs almost no return.
Step 5 · From target to plan
The simulation identified 40% / 3 h as the economic target. But no transformer or inverter on the market maps exactly to that size. So the question became a practical one: what can actually be bought, and how can it be designed? The answer is a system designed around the nearest standardised transformer station — which equals ~45% of the grid connection, and in turn yields a real duration of 2.8 hours instead of 3.
That is a feature, not a compromise. Because the IRR curve is flat near its peak, the planned ~45% / 2.8 h design sits on the value plateau: the small step up in power and step down in duration roughly offset, so it captures essentially the full value of the target while being something greentech can actually procure and connect. The system is currently in the planning phase.
Economic target
40% · 3 h
Base-case IRR 9.35% (vs. 8.69% PV-only).
Planned design
~45% · 2.8 h
~45% of the connection, framed by a standardised transformer and available components. In planning.
Value impact
≈ full upside
On the flat top of the IRR curve, the planned design captures essentially all of the target's value.
The method, generalised
What transfers.
This project is one example, but the approach is the point. Three lessons generalise to any co-location — and one deliberately doesn't.
Takeaway 01
Storage sizing is an optimisation, not a product.
There is no off-the-shelf "right" battery size. The IRR-maximising point depends on the grid limit, the generation profile and the available markets — it has to be computed, not assumed.
Takeaway 02
The value is in the translation, not the model.
A simulation that ends at "40% / 3 h" isn't a decision. The worth is converting it into a procurable design that holds the IRR — here, a system on a standardised transformer station.
Takeaway 03
Oversizing destroys IRR.
Beyond the optimum, IRR falls below the PV-only baseline: the extra CapEx earns less than it costs. The economic optimum is reached well before maximum throughput.
Takeaway 04
Every project still needs its own run.
The method transfers; the numbers don't. A different site, grid limit or generation profile will have a different optimum — so each project is evaluated on its own parameters.
Outlook
×Where this goes next.
With this analysis, greentech demonstrates competence in the development and the dimensioning of co-located storage. Catalyst serves as the enabler: turning a sizing question into a defensible, project-specific IRR rather than a rule of thumb.
Beyond developing its own projects, greentech also supports external partners. With the Co-Location Potential Analysis, the solar and storage specialist assesses existing or planned PV sites for their suitability for a battery storage system, reviews grid and land constraints, prioritises sensible PV-BESS options, and — on request — supports the project development process all the way through to construction readiness.
The IRR is computed on the full 30-year project cashflow from a quarter-hourly co-optimisation of a PV co-location in Germany (PV capacity ~130% of the grid connection, ~1.3× overbuild) across the EEG, Day-Ahead and Intraday markets (no ancillary-service revenue; green-power storage charges only from PV), on the central price path under two PV generation profiles (P50 / P90). Cashflows include 2% inflation. PV CapEx 460 €/kW (≈ €11.91M), PV OpEx 3.3% of CapEx p.a.; storage CapEx 138–292 €/kWh plus 5 €/kW, storage OpEx 3.5% of CapEx p.a., 20-year battery life with no replacement (retired after year 20, no re-CapEx). All IRRs are unlevered (all-equity). The study presented covers 42 business cases. Economic assumptions reflect greentech's working model. Modelled results are a basis for design decisions and do not constitute investment advice. Every co-location project must be evaluated on its own parameters.
Model your own projects
Apply the methodology directly to your projects — with personalized scenarios, site parameters, and auditable results.